Resource:How to Analyze Resources on Your Campus
About the Venn-Diagram
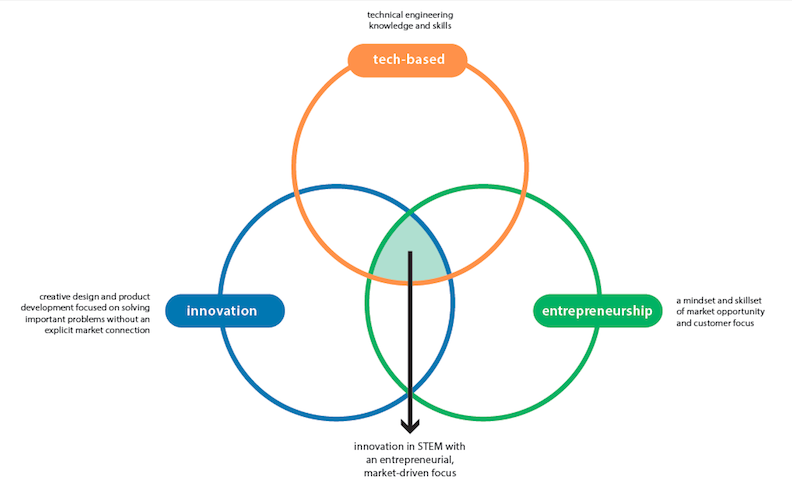
The venn-diagram illustrates the space society is currently operating in: technology, innovation and entrepreneurship. Many strategic resources will be placed in one to two of the sectors, but rarely all three. Because of this, the center area is not well filled with strategic resources and this venn-diagram can help in creating solutions for this by identifying a strategic resource's current placement and creating ideas on how to incorporate the missing sector(s). To find fit, analyze the offerings and markets served by a select strategic resource. When a strategic resource incorpates and engages technology, innovation and entrepreneurship, it is located in the "sweet spot."
Many different disciplines already exemplify and bring in innovation. Innovation is embedded in much of the space society operates in. Entrepreneurship education teaches how to start and create a venture, including understanding value proposition and market segments (to name a select few). An innovation and entrepreneurship overlap is fundamentally important. However, what is typically seen is often-times non-technology based solutions. When we add this technology-based, cutting edge science, we deliver scalable, highly disruptive solutions.
So, how do we create technological solutions and look at new and novel ways to bring about change in society? How can we engage these resources to the center to serve engineering education? How do we encourage STEM majors to think entrepreneurially?
By meeting in the middle. The center is an underserved area and this needs to change.
View the Wenger Model on to see how to measure a movement here.
